
Dust correction
Astrophysical dust forms in the atmospheres of evolved stars and is released into the interstellar medium after the stars die. Dust grains may seem like the most uninteresting object to study in the universe, but dust is actually one of the most important components to consider when doing astronomy research.
Dust extinction occurs when light from an object gets scattered or absorbed by dust. This is different from dust attenuation, which refers to the combined effect of extinction and the relative geometry of stars and dust along the line of sight (see figure). In both cases, light gets scattered and absorbed as it interacts with dust particles.
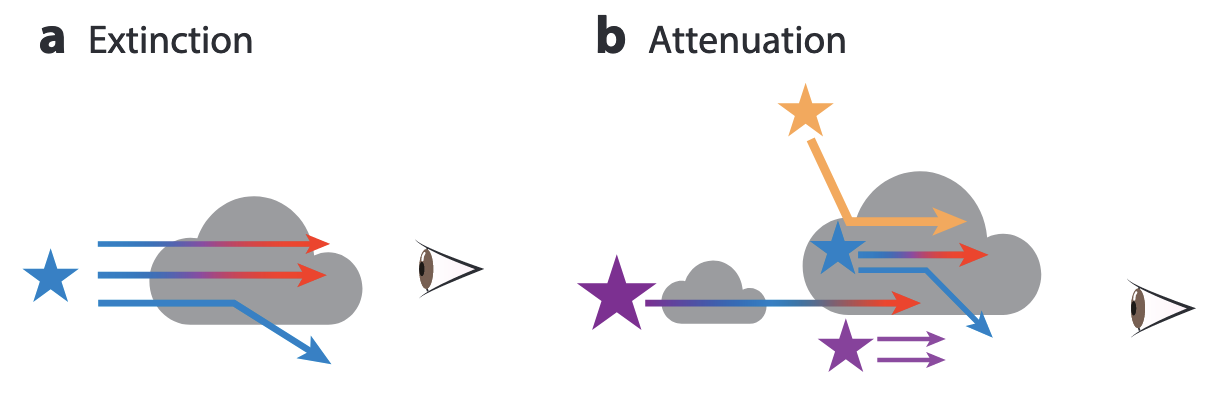 Figure from Salim & Narayanan (2020)
Consider a star. The star will be emitting radiation at all wavelengths. When the light from the star travels towards us, it encounters interstellar dust, where extinction occurs. These dust grains range from 5 to 300 nm in size, and since light is more efficiently scattered by particles with comparable size to its wavelength, it is the UV range of the electromagnetic spectrum that gets scattered more. Conversely, the infrared end of the spectrum is transparent to the dust, and is able to pass through the dust with its flux largely undiminished.
A galaxy contains many stars. It contains a lot of dust too. This means that when a light from a galaxy reaches our detector here on Earth, it has likely passed through these dust columns and has been “reddened”, i.e. its blue wavelengths have been removed, making the galaxy appear redder.
Most, if not all, of our measurements of galaxy properties are based on its light– galaxy mass, star formation rate, molecular gas mass, etc. It is therefore essential as a first step to account for the reddening effect caused by dust. Otherwise, all our measurements of galaxy properties will be systematically biased!
Correcting for dust reddening is twofold: we must correct for the extinction inside the galaxy that we are observing (internal extinction), and for the extinction in the galaxy from which we are observing–the Milky Way galaxy (foreground extinction).
- Foreground extinction
The most widely used galactic extinction map is from Schlegel, Finkbeiner, & Davis (1998)
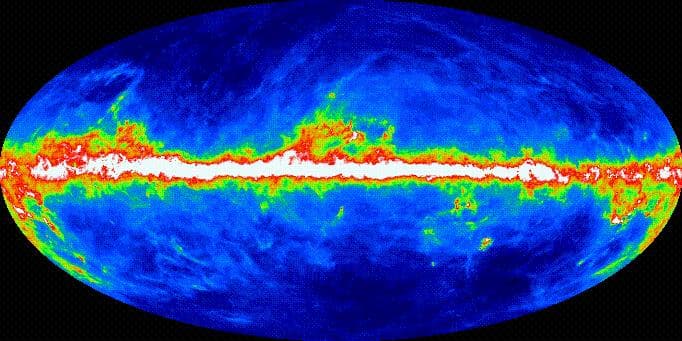 Blue is low intensity, red and white are high-intensity regions. Figure from Schlegel, Finkbeiner, & Davis (1998)
Internal extinction
Steps for correcting internal extinction:
- Step 1: Assume an extinction curve shape (MW, LMC, SMC)
- Step 2: Determine normalization (e.g. E(B-V)) by using the Balmer Decrement.
- See sample code here for correcting internal extinction.
Below is a comparison of a galaxy’s fluxes before and after correction:
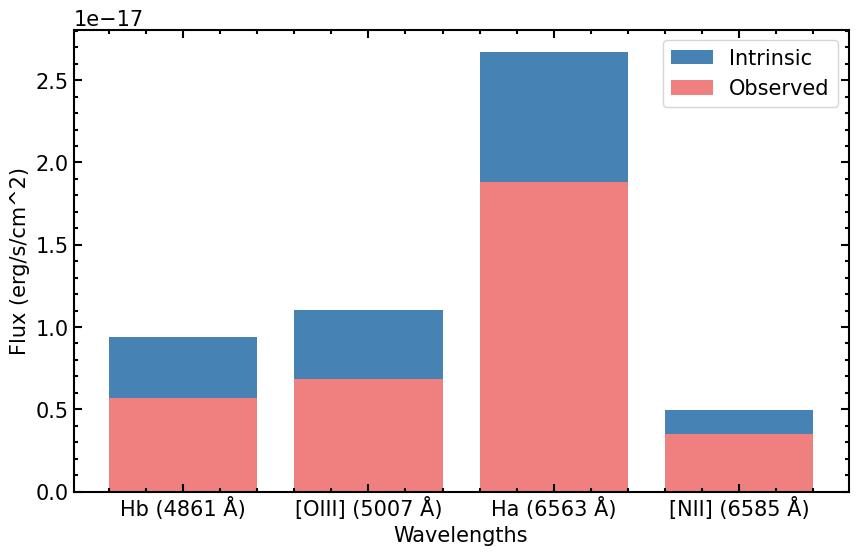
Look at the amount of light we lost due to dust!